discovery

How to Do Desk Research in 5 Simple Steps

15 min read
Olesia Havryshko
Olesia Havryshko
29 Feb 2024
How to Do Desk Research in 5 Simple Steps Cieden

Before you launch a product, you should get answers to several questions. The first and, we believe, most important one is to define the overall market situation and take a closer look at the potential customer. Mastering how to do desk research is a suitable, cost-effective way to get information for making data-driven decisions.

In this article, we’re going to highlight some essential tools for conducting desk research and defining user groups.

What is desk research?

Desk research (also called secondary research) is a research method that involves using existing data. This technique will allow you to get the first idea of your market and users “from your desk.”

Secondary research includes already published materials in reports, articles, or similar documents. We also recommend using software tools that can help you become more familiar with your users (you can find some of them below).

This method is much more cost-efficient than primary research and requests less time for conducting it. Still, a lot of analysis work should be done, and the result is really helpful. The best way is to mix qualitative user research and desk research. It’ll help you fit into your timelines and budgets.

Illustration that shows what is desk research.

Primary vs. secondary research

Since we’ve just mentioned primary research, let’s see what it is and how it differs from secondary desk research.

Ask around and do your own digging


Primary research
refers to the process of gathering firsthand data directly from the source, be it customers or prospects. This approach takes more time and effort than desk research, but you get the latest and most detailed information.

The most common primary research methods include the following:

  • interviews;
  • surveys;
  • questionnaires;
  • competitor reviews;
  • focus groups;
  • market mapping.
Check what others have already learned


Secondary research
, or desk research, involves analyzing existing data and information collected by someone else or for another project or research purpose. It’s often the starting point for market research, providing foundational knowledge from pre-existing data. This method is quicker and easier than primary research, but the information you get might be older or less specific.

The desk research methods include gathering data from the following sources:

  • internet;
  • government databases;
  • reports;
  • academic journals;
  • social media.
Primary or secondary research? Use a checklist


While both research methodologies are helpful, you may be wondering when to use each. 

Go for primary research when you:

  • need up-to-date information not readily available;
  • study specific questions or problems not addressed in existing research;
  • require in-depth info directly from your target audience;
  • aim to test new ideas.

Desk research often paves the way for primary research. Chose this approach when you:

  • need a basic overview of a topic or industry;
  • want to get a background knowledge and context;
  • aim to study existing trends and statistics;
  • want to compare different perspectives on the same topic;
  • seek to save time and resources.

Pros and cons of desk research

Desk research is a valuable tool for any researcher. But, like any tool, it has its strengths and weaknesses. 

Pros of desk research

Using desk research methods is highly beneficial. Here are just several reasons for that:

  • Budget-friendly. Compared to primary research, desk research is more cost-efficient. You’re using existing information at low to no cost instead of generating it yourself.
  • Fast. Desk research lets you access data and reports instantly, offering quick insights without lengthy data collection.
  • Scalable. Desk research allows you to cover vast amounts of data.
  • Readily available data. Data for desk research is readily available online, and you can access it anytime.
  • Insightful. With careful searching, you can find helpful reports, studies, and expert opinions that provide valuable perspectives on your topic.

Cons of desk research

Despite the advantages, desk research comes with its cons. Here’s what to prepare for:

  • Outdated data. Data for desk research can quickly become outdated, so verifying its relevance is a must.
  • Limited control. You’re relying on someone else’s data, meaning you can’t control its methodology or accuracy.
  • Minimal exclusivity. Desk research findings are readily available to others, therefore they’re not exclusive to your unique project.
  • Verification complexities. Verifying data sources and interpreting information can be time-consuming.

Types of internal and external data sources

Desk research is a way to gather insights literally without leaving your desk. But where do you find the necessary info? Let’s look at the secondary data sources available to you:

Internal data sources

Internal data sources for desk research.

Your company is already a goldmine of information. So before jumping into other types of desk research, consider digging into internal resources:

  • Historical campaigns and sales. Review past campaigns, website traffic insights, sales conversions, and other relevant data.
  • Product analytics. Dive into product analytics to learn more about different customer segments, user behavior, engagement patterns, performance metrics, and user flows.
  • Internal research. Use existing internal research reports and studies (if any) and get insights from them.

External data sources

External data sources for desk research.

Besides studying your company information, there are plenty of external resources to explore. Look into the following examples of secondary data:

  • Internet. Access any type of resources through the web.
  • Commercial resources. Industry reports or market research studies by third-party firms can offer data specific to your topic.
  • Trade associations. Use reports and resources from trade associations, for example, the Directory of Associations, the National Trade and Professional Associations Directory, or the Encyclopedia of Associations.
  • Industry experts. Connect with industry thought leaders and analysts.
  • Research associations. Access independent research papers and industry publications.
  • Media. Monitor news, press releases, magazine articles, and TV and radio content to get information on your topic.
  • Market research software. Leverage specialized software platforms that offer advanced analytics, reports, or access to industry data.
  • Government data. Use statistics and reports from government agencies like the US Census Bureau, US Government Publishing Office, US Small Business Administration, and so on.
  • Local government data. Get market data, demographic info, and employment trends through local gov websites.
  • Public libraries. Access library databases through the Digital Public Library of America or the National Archives in the UK.
  • Competitors. Study competitor websites, press releases, mailing lists, online reviews, and social media activity.
  • Educational resources. Analyze academic research papers and journals relevant to your topic.

Examples of desk research

Let’s now explore some examples of design projects leveraging desk research:

Analyzing dreams with Sleepify

The creator of the Sleepify project sought a user-centric design for an app tracking dreams and well-being. They leveraged external desk research and competitor analysis to:

  • study sleep’s impact on a person’s well-being through UCE Research and ePsychologi.pl platforms;
  • discover the strengths and weaknesses of competitor apps.

The secondary research findings, along with quantitative research, were used for creating a high-fidelity prototype, ready for user testing and validation.

Example of high-fidelity app prototype, created owing to desk research.

Keeping users fit with MYFIT

MYFIT project suggests creating a fitness app packed with workout routines, aimed to boost user engagement and retention. It is expected to be a clean, stylish, and modern fitness app designed to keep users active and motivated. The designer proposes to tackle this challenge by:

  • researching user behavior and frustrations with existing apps using various methods;
  • exploring why users abandon fitness apps;
  • creating optimal user journeys.
A fitness app created owing to user and desk research.

Reaching personalized sales with AI

Designers aimed to explore the potential of using AI for personalized sales in the gaming industry. Their desk research targeted:

  • The global market size of generative AI in business, its usage in gaming, and sales marketing.
  • Industry gap. While personalization thrives in eCommerce, the gaming industry lags behind.

The insight the designers derived is that a personalized AI tool based on in-game actions, purchase history, demographics, and player data could revolutionize game sales.

Five steps to conduct desk research

As already mentioned, the reason to conduct research is to become more familiar with your users and potential customers. Your focus should be on collecting notable data and analyzing it. Here’s how to do this in five steps:

1. Determine your research topic and goal

Before even starting your research, ask yourself what you want to study and why. Outline the questions you aim to answer or the information you’re looking for. Is it to understand industry trends or handle customer journey mapping? The more specific your question, the easier it will be to steer your research in the right direction.

2. Choose relevant secondary data sources

Go through internal and external resources relevant to your topic, making sure they are credible and objective. Make a list of resources suitable for your research topic and goals.

3. Explore existing data

Go down your resource list and find relevant data. Here’s what you can study:

Literature sources

Most likely, you should start with the existing text available in the public domain. What to look for? Everything! You can go through government or private companies’ reports, the original material on which these reports are based, conference proceedings, primary periodicals, official publications, and articles in newspapers and journals. 

This method of data collection is the most inexpensive and nontime-consuming way.

Document analysis

Document analysis is an important part of business analysis. This process includes the examination of existing documents and recordings. In some way, you are using the research that has already been completed.

The objective of this process is to track changes over the whole period. You can analyze logs, email logs, databases, web analytics, minutes of meetings, staff reports, and information logs. These are only a few examples of the sources for this type of research.

For instance, before redesigning the existing product, you have to understand the reason for the low level of purchases or numerous complaints in support. Documents and records help track the interaction between employees and customers or between your current website and customers. This is the way to make correct conclusions.

Competitor analysis

Knowing your competitors helps analyze the existing solutions and define the current problems they cover. Obviously, to share the entire experience and provide an ultimate guide for conducting competitive research, we have to write a whole new article. Here are some points to pay attention to:

  • determine the products your competitors offer;
  • pay attention to their sales tactics and results;
  • analyze how they market their products;
  • take note of their content strategies;
  • look at competitors’ social media presence, strategies, and go-to platforms;
  • make a SWOT analysis to learn their strengths, weaknesses, opportunities, and threats.
Handy tools for conducting a competitive analysis

There are a lot of tools that may help. We’d like to share some of those that we use while conducting desk research:

  • Crunchbase is a live company database, which updates constantly. This tool helps you identify upcoming marketing tendencies. For example, you can find how many companies in a specific industry are raising.
  • Capterra is an intermediary between buyers and technology vendors within the software industry. Here, you can find the most comprehensive lists of products per industry, reviews, ratings, and infographics, and easily compare needed competitors.
  • Serpstat is one of the top-rated SEO tools and definitely will help you outline competitor analysis just by entering your domain.
  • Semrush analyzes the data for you and gives you instant recommendations on SEO, content marketing, and advertising that help you improve your online visibility in days.

4. Organize and compare your data

Gathering data is just the beginning. Now, you should organize and make sense of it. Consider using mind maps or spreadsheets to structure your data. Remove any duplications as well.

5. Analyze your data

Now that you have your data in a digestible format, analyze it for helpful insights. Check if the gathered data answers the questions you aimed to study. If not, go back to step two and find other sources of information.

How to do desk research.

Useful resources for defining your user groups

As soon as you finalize your desk research, you will most likely be able to group your users. So now it’s time to take a deeper look at them. Here are some free tools you can use to identify your user personas.

Google Analytics

If you already have launched your website, don’t forget to insert the Google Analytics tracking code. It will help you get more information about your clients. Now we’ll share which reports we suggest using:

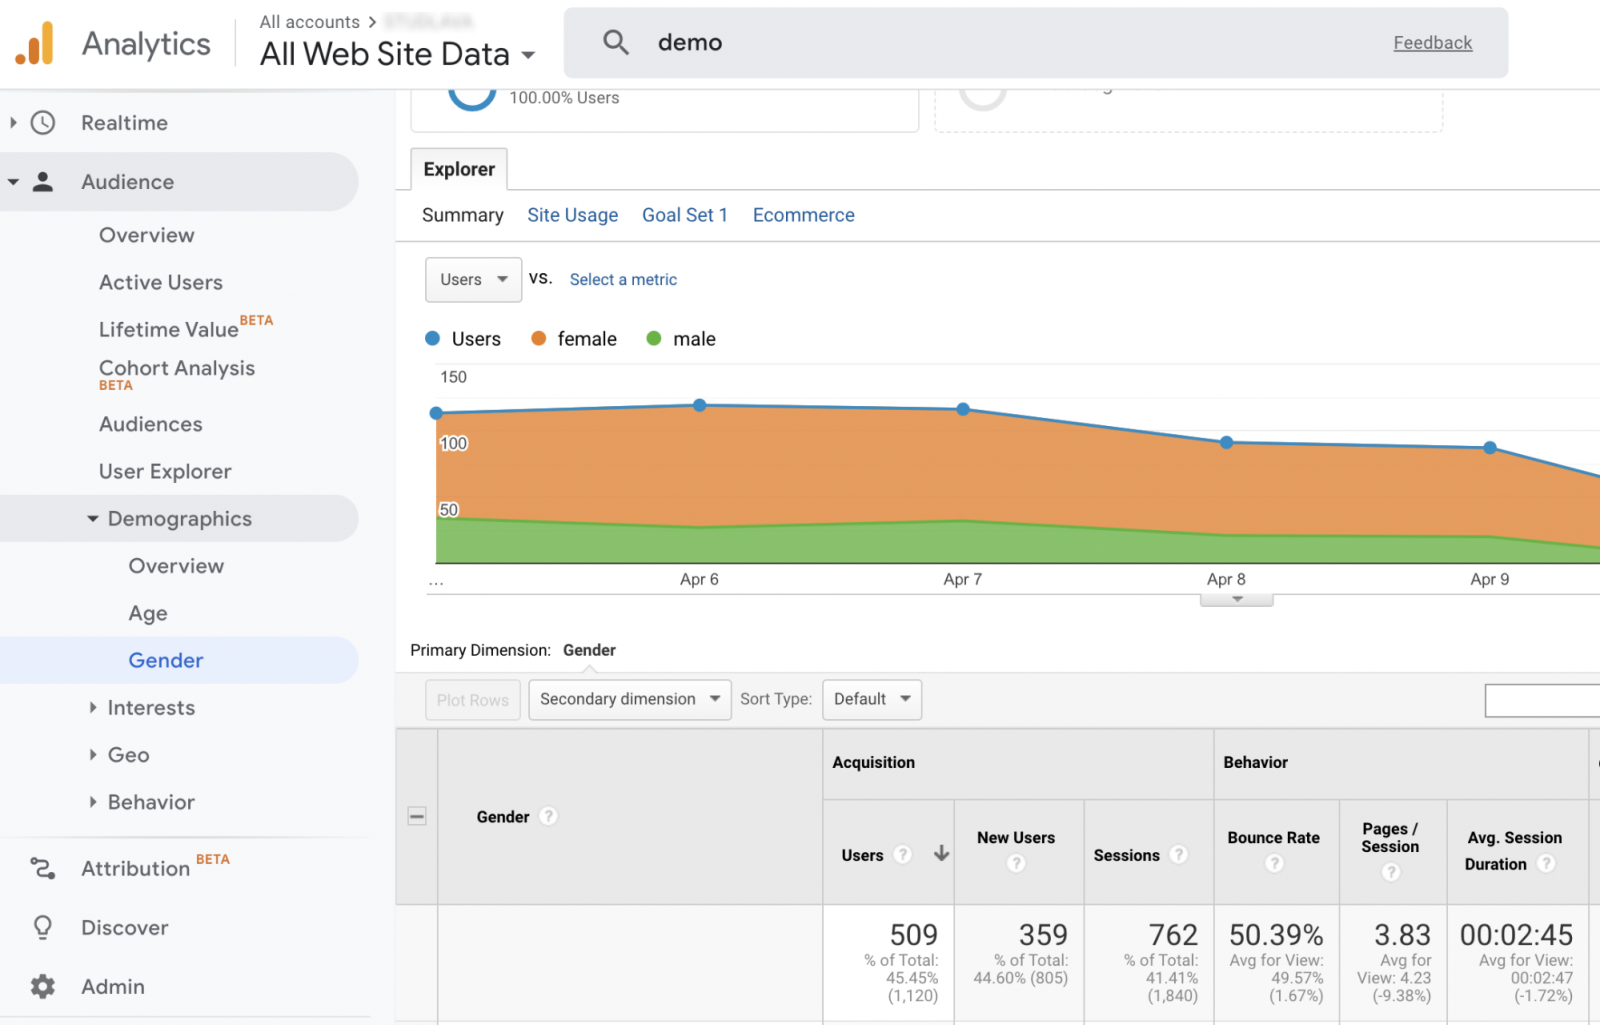
1. Demographics: Age/Gender

This report shows the key age group and gender of your website visitors. To kick off the demographic report, follow the flow: Audience tab at the left menu > Demographics > Overview.

Age and Gender Demographics in Google Analytics.
2. Demographics: Affinity categories

Learn more about the preferred interests of your users. As you have already opened an Age or Gender report, you can add a secondary dimension. Select ‘Affinity Category’ at the dropdown. You will see all the segments your visitors are interested in. It is helpful to identify your ideal online customers at scale.

3. Demographics: In a market segment

One more good analytics tool to identify the users who are actively researching and comparing items across the Google Display Network (YouTube, paid search results via AdWords, display ads via AdSense, etc.)

4. Geo

This report will provide you with an overview of all the languages your users have set in their browsers and the locations where they may live. It will be useful in understanding cultural differences and will decrease effort for your marketing campaigns.

5. Devices

If you’re going to create a mobile app, think about which devices your guests are most likely to use to access your website. Go to Audience > Benchmarking > Devices. After that, dive deeper into Mobile Devices’ info. You will see exactly which brand of mobile devices they are using. Go to Audience > Mobile > Devices.

So, we’ve just outlined some useful data to understand your users better. Now, let’s move forward to other sources.

Facebook Insights

As almost everyone over the Internet is a social media user, it is good to use the data it represents. It will help you create more target posts and campaigns that cover your customer needs.

1. Take a look at the existing customer list

If you already have a customer list or just a list of users with phones or email addresses, you can use it to gain extra information about these people.

You need a list in the .csv file. In the Facebook Ads Manager, you can create a custom audience. Then Facebook Audience Insights will finish uploading the list, and you will receive a ‘Ready’ notification. At this point, you can analyze your audience.

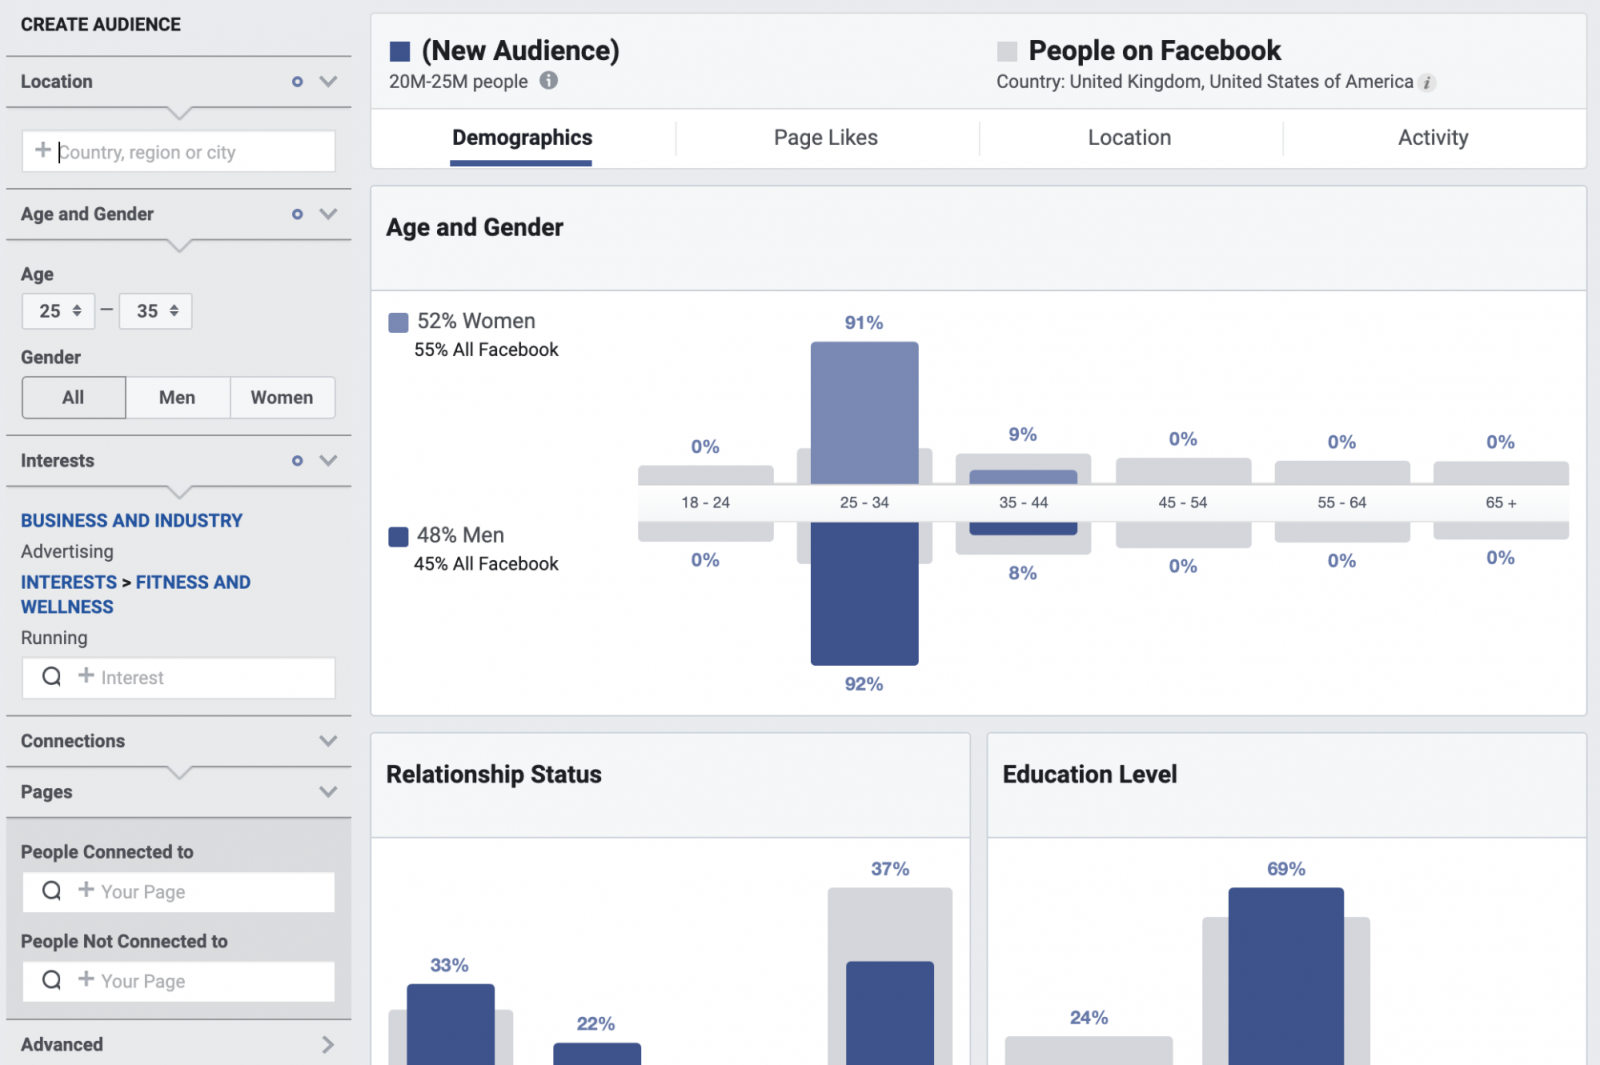
2. Analyze required audience

Initially, you need to open an Audience Insights tool. You can choose an Audience you want to analyze. This tool can give you access to such data:

  • age, gender, and relationship status;
  • lifestyle preferences, demographics, and interests;
  • education level and job title;
  • Facebook pages that are likely relevant to your audience;
  • top cities, countries, and languages;
  • frequency of certain activities;
  • device usage;
  • household size and estimated household income;
  • homeownership status and house market value;
  • spending methods, purchase behavior, and estimated retail and online retail spending habits.
Analysis of Required Audience on Facebook.
3. Find your potential customers

Even if you don’t have a customer list yet, you can use generic insights connected to your Business Page. You can also use software tools that provide you with potential customer emails. Take a look at these tools:

  • Snov.io helps find more convertible leads, verify contacts, track your lead’s progress, and automate cold outreach.
  • Hunter is a cloud-based email search solution that helps businesses find emails on company websites, verify domains, compose follow-ups, and more.

Try to pull out the most useful insights about your potential users, finalize all the gathered information, and be sure your team is aware of the user groups you are trying to reach.  

LinkedIn

LinkedIn is one more powerful resource for collecting data. A good LinkedIn profile is a pretty ready proto persona. You can discover the user’s location, career path and goals, achievements, and daily work responsibilities. It is especially useful for B2B marketing. By the way, if you are in this segment, you can also use tools like Leadfeeder to understand which companies are visiting your website.

Now, we will break out four components that could be revealed from LinkedIn: business attributes, pain points, hangouts, and values.

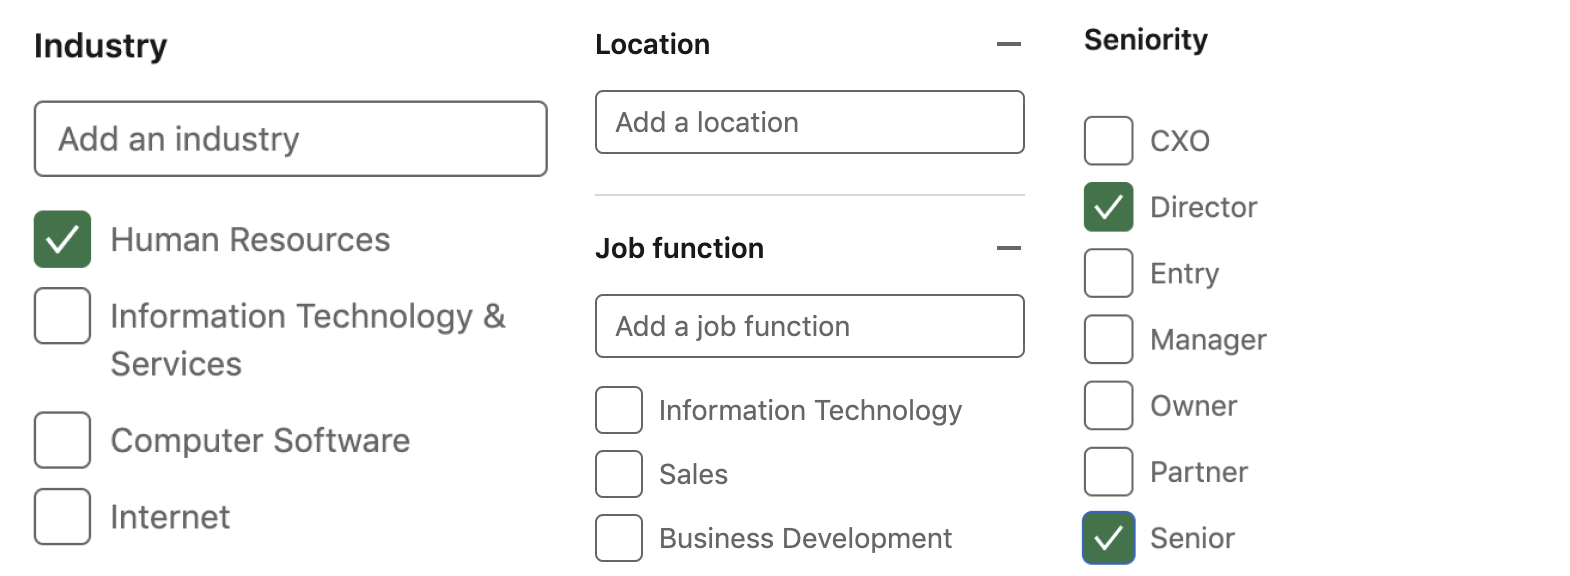
1. Business attributes

They give you a deeper view of the demographics of your business page followers and visitors. What can you gather here? You can see location, job function, seniority, industry, company size. There is also data about similar companies and the comparison in analytics. It’s a great specific tool to reinforce Google Analytics.

Business attributes example from Linkedin.
2. Personal profiles

Pay attention to the sections ‘Summary,’ ‘Skills & Endorsements,’ ‘Activity,’ and ‘Interests.’ 

In ‘Summary,’ we can get an overview of the person’s work trajectory, education, and main skills. From the ‘Skills & Endorsements’ section, we can receive data about a person’s strengths and people who endorsed their skills (who can also be useful in the research). The ‘Activity’ section is a great way to observe what the person is talking about, what they like, and comment. ‘Interests’ shows a list of the following companies and people, so it is possible to examine what engages the person.

Personal profile example from Linkedin.
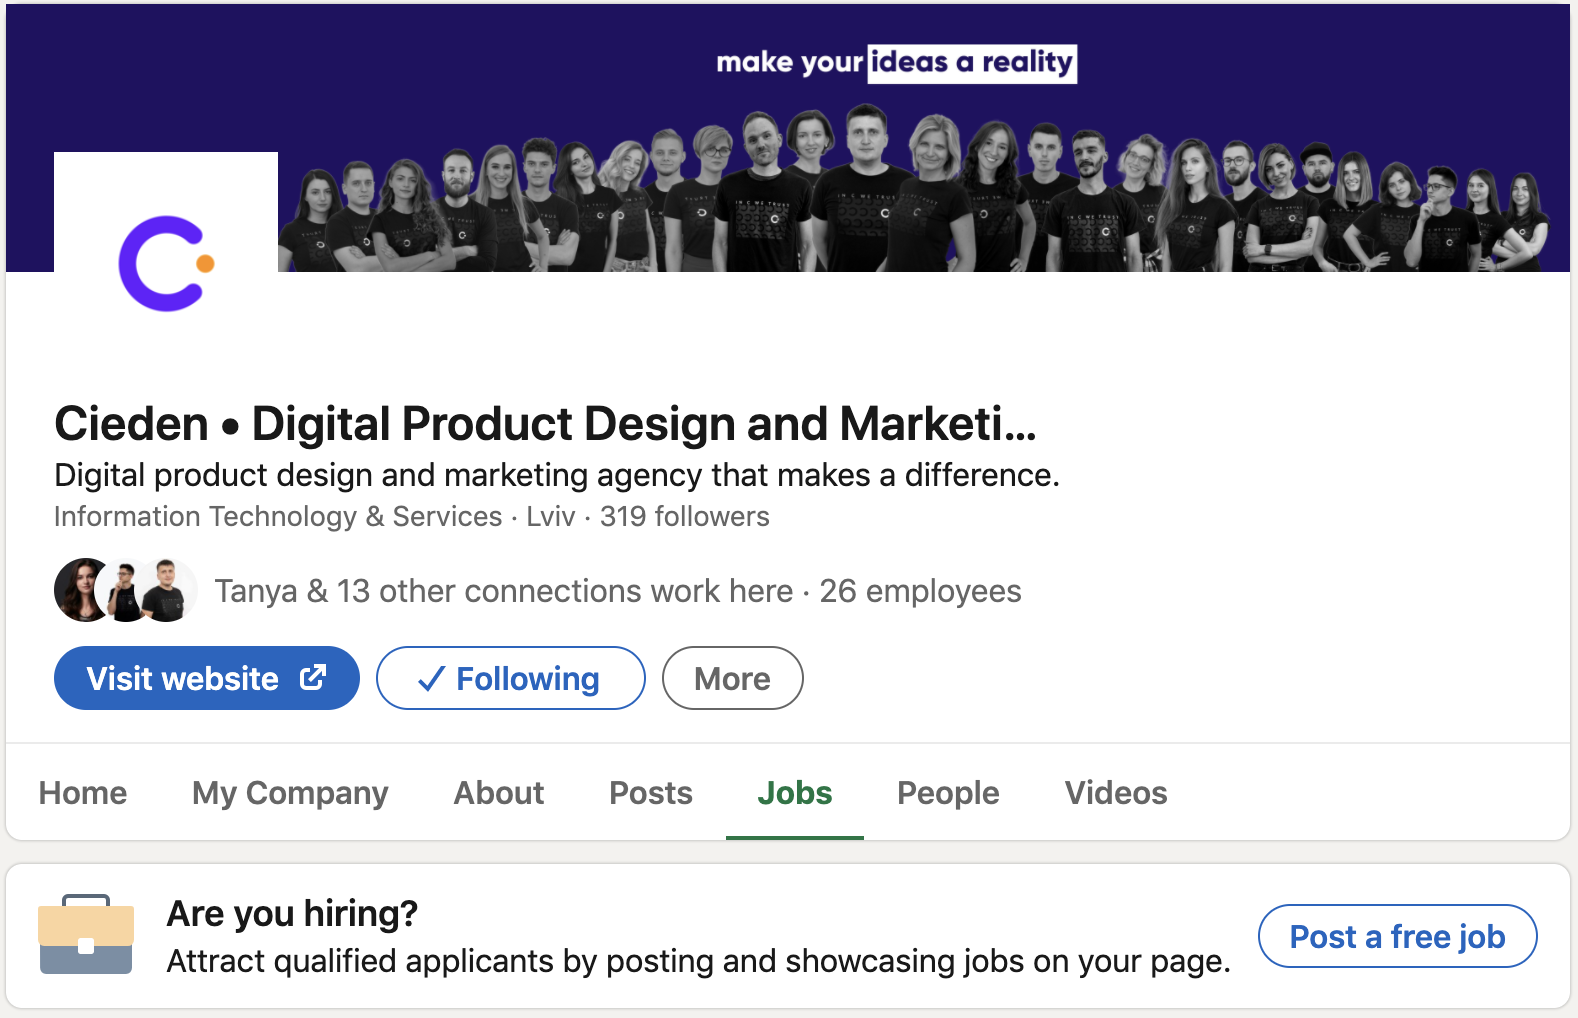
3. Company pages and job postings

Company Page includes information about the history, size, and career opportunities. Such pages also may have stories about employees and their quotes. The company’s job descriptions show the professional attributes required of a candidate.

Company pages and job posting example from Linkedin.

After gathering all this data, you can create a direct message to increase the chances that relevant people will view it. How to do it? Open your Company Page > Click on ‘Create Post’ > Manage Post Audience: from Anyone to Targeted audience. Add some specific details about your audience.

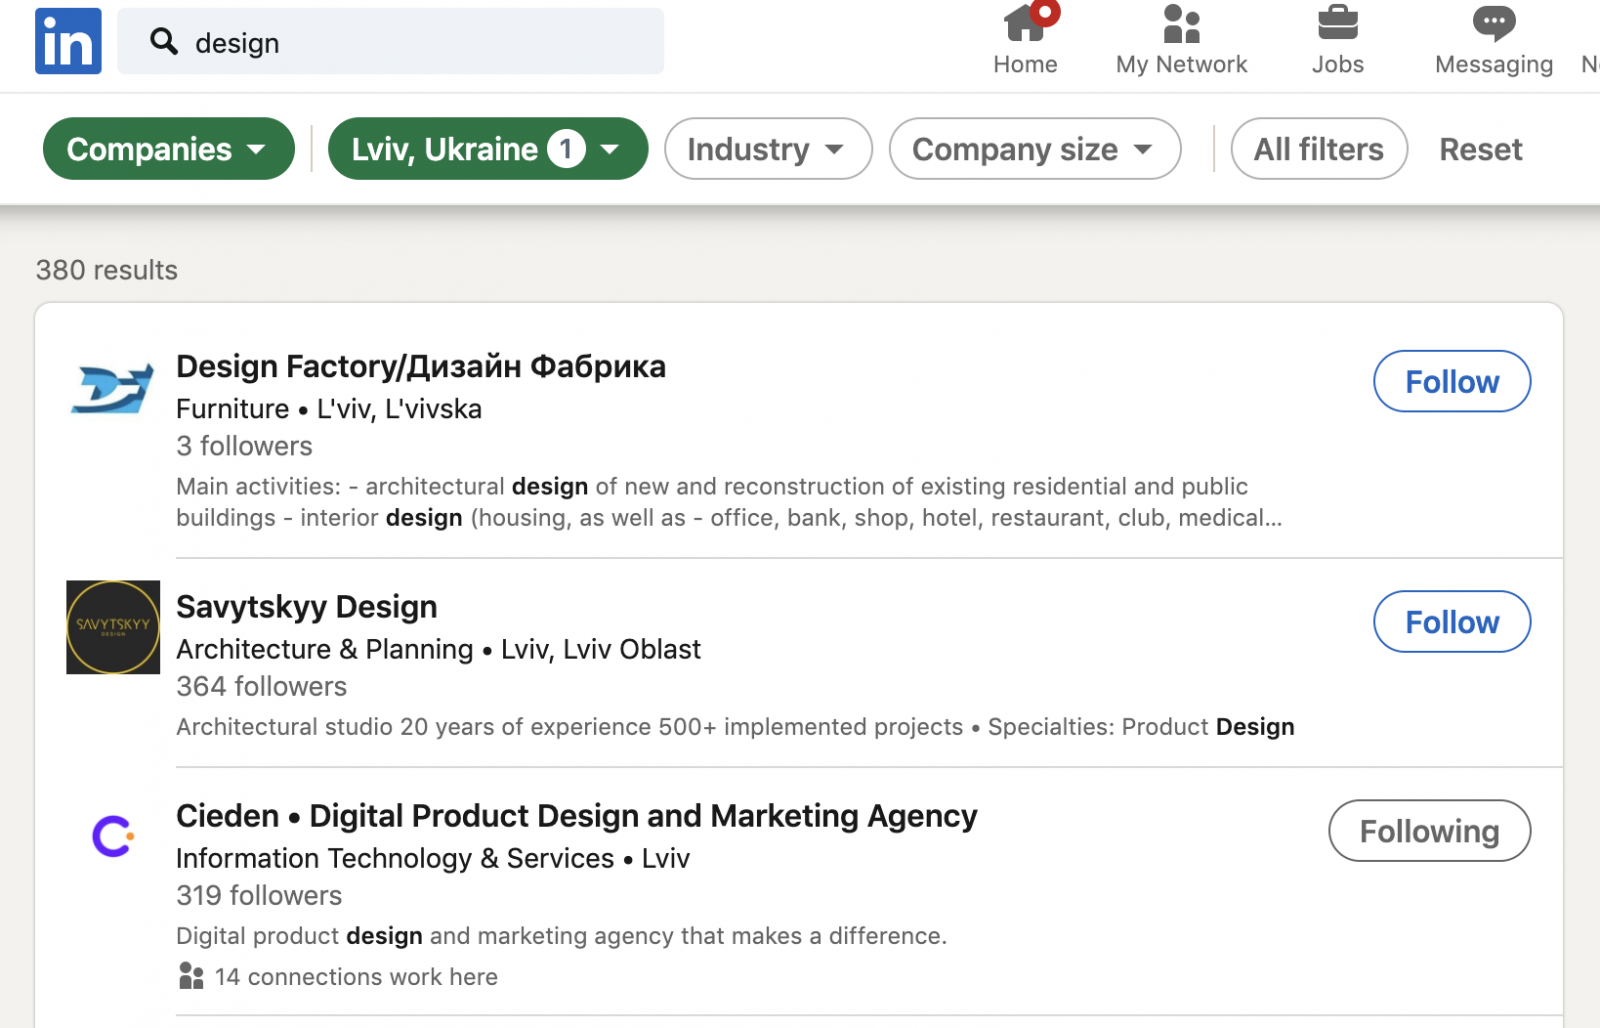
4. Advanced Search

Use LinkedIn Advanced Search to earn data about market size and the number of required companies or people. By working on the filters, you can find more insights about locations, education, seniority levels, etc.

Advanced Search feature from Linkedin.

Last thoughts

Taking market temperature and understanding your audience are the key ingredients in a way to creating a successful product. Pay attention to detail, document the whole process, and share it with your team and all the stakeholders. Help them to keep an empathic approach to your product and audience.

Have a great time conducting research. If you will need professional help with it, feel free to contact us.

Did you like the article?

Help us share it:

How to Do Desk Research in 5 Simple Steps Cieden

FAQ

What is the desk research method?

Secondary desk research is a research method that involves collecting and analyzing information from existing sources like reports, articles, and websites. This approach is particularly valuable in the early stages of prototyping, as it helps to gather essential insights with a streamlined resource investment.

How to do UX desk research?

To do UX desk research, follow these steps:


1.Define your goals and research questions,

2.Choose secondary data sources like usability studies or industry reports,

3.Go through the data relevant to your research,

4.Structure and compare the gathered data,

5.Analyze the data to make necessary UX improvements.

What are examples of desk research?

Desk research examples may include studying competitor websites to offer better solutions, reviewing industry reports to learn the latest trends, or analyzing historical sales data to predict future sales tendencies.

What are the two types of desk research techniques?

The types of desk research methods include internal desk research and external desk research. The first approach studies data within your organization, while the second gathers information from external sources like academic journals, research associations, or government databases.

start your project with us.

Getting in touch
is easy .
Thank you for your message. It has been sent