ux/ui essentials

How Many Participants Should Be in a Study? (Hint: Fewer Than You Think)

Tamara Zhostka
Tamara Zhostka
13 Jan 2025
How Many Participants Should Be in a Study? (Hint: Fewer Than You Think) Cieden

You don’t need a stadium full of people to figure out if your app needs work.

Five users can spot the same bugs 50 would. Ten interviews can reveal what’s broken in your design. A well-run survey with 100 participants can tell you what your entire user base thinks without breaking the bank.

The trick is knowing exactly when you need precision and when smaller, focused samples will do the job just as well. This guide is your cheat sheet to saving money and getting the information you need to build products that work and wow.

TL;DR: How many participants do you really need?
Research Method Recommended Participants
User Interviews 8-12 participants
Usability Testing 5-9 participants
Focus Groups 3-4 sessions, 6-8 participants each
Co-Design Sessions 10-12 participants
Surveys 90-100 responses
A/B Testing 10,000+ participants per variation
Baseline Usability Testing 15-20 participants
Benchmarking 20-30 participants

Why and how: The two sides of research

Great research starts with knowing the right question to ask: Are you trying to understand why users behave a certain way or do you need hard numbers to make a decision?

  • qualitative research is for the ‘why’ questions. Why did your users click that button but abandon the checkout? Why is navigating your app so frustrating? With this type of research, you can sit down with real users through interviews or usability tests and study their struggles and preferences. It's perfect for the early design stages when you’re shaping the big picture. 

  • quantitative research is about the ‘how.’ How many users drop off at step three of your signup process? How often do users click the call-to-action button? With quantitative research, you’re working at scale, using online surveys and A/B testing to validate ideas and prove your changes work. It's best for when you need stats to back up your next big move.

Start with qualitative to hear user insights firsthand, then let quantitative data confirm the trends.

Qualitative vs quantitative research

How many participants should be in a qualitative study?

When it comes to qualitative research, less really is more.

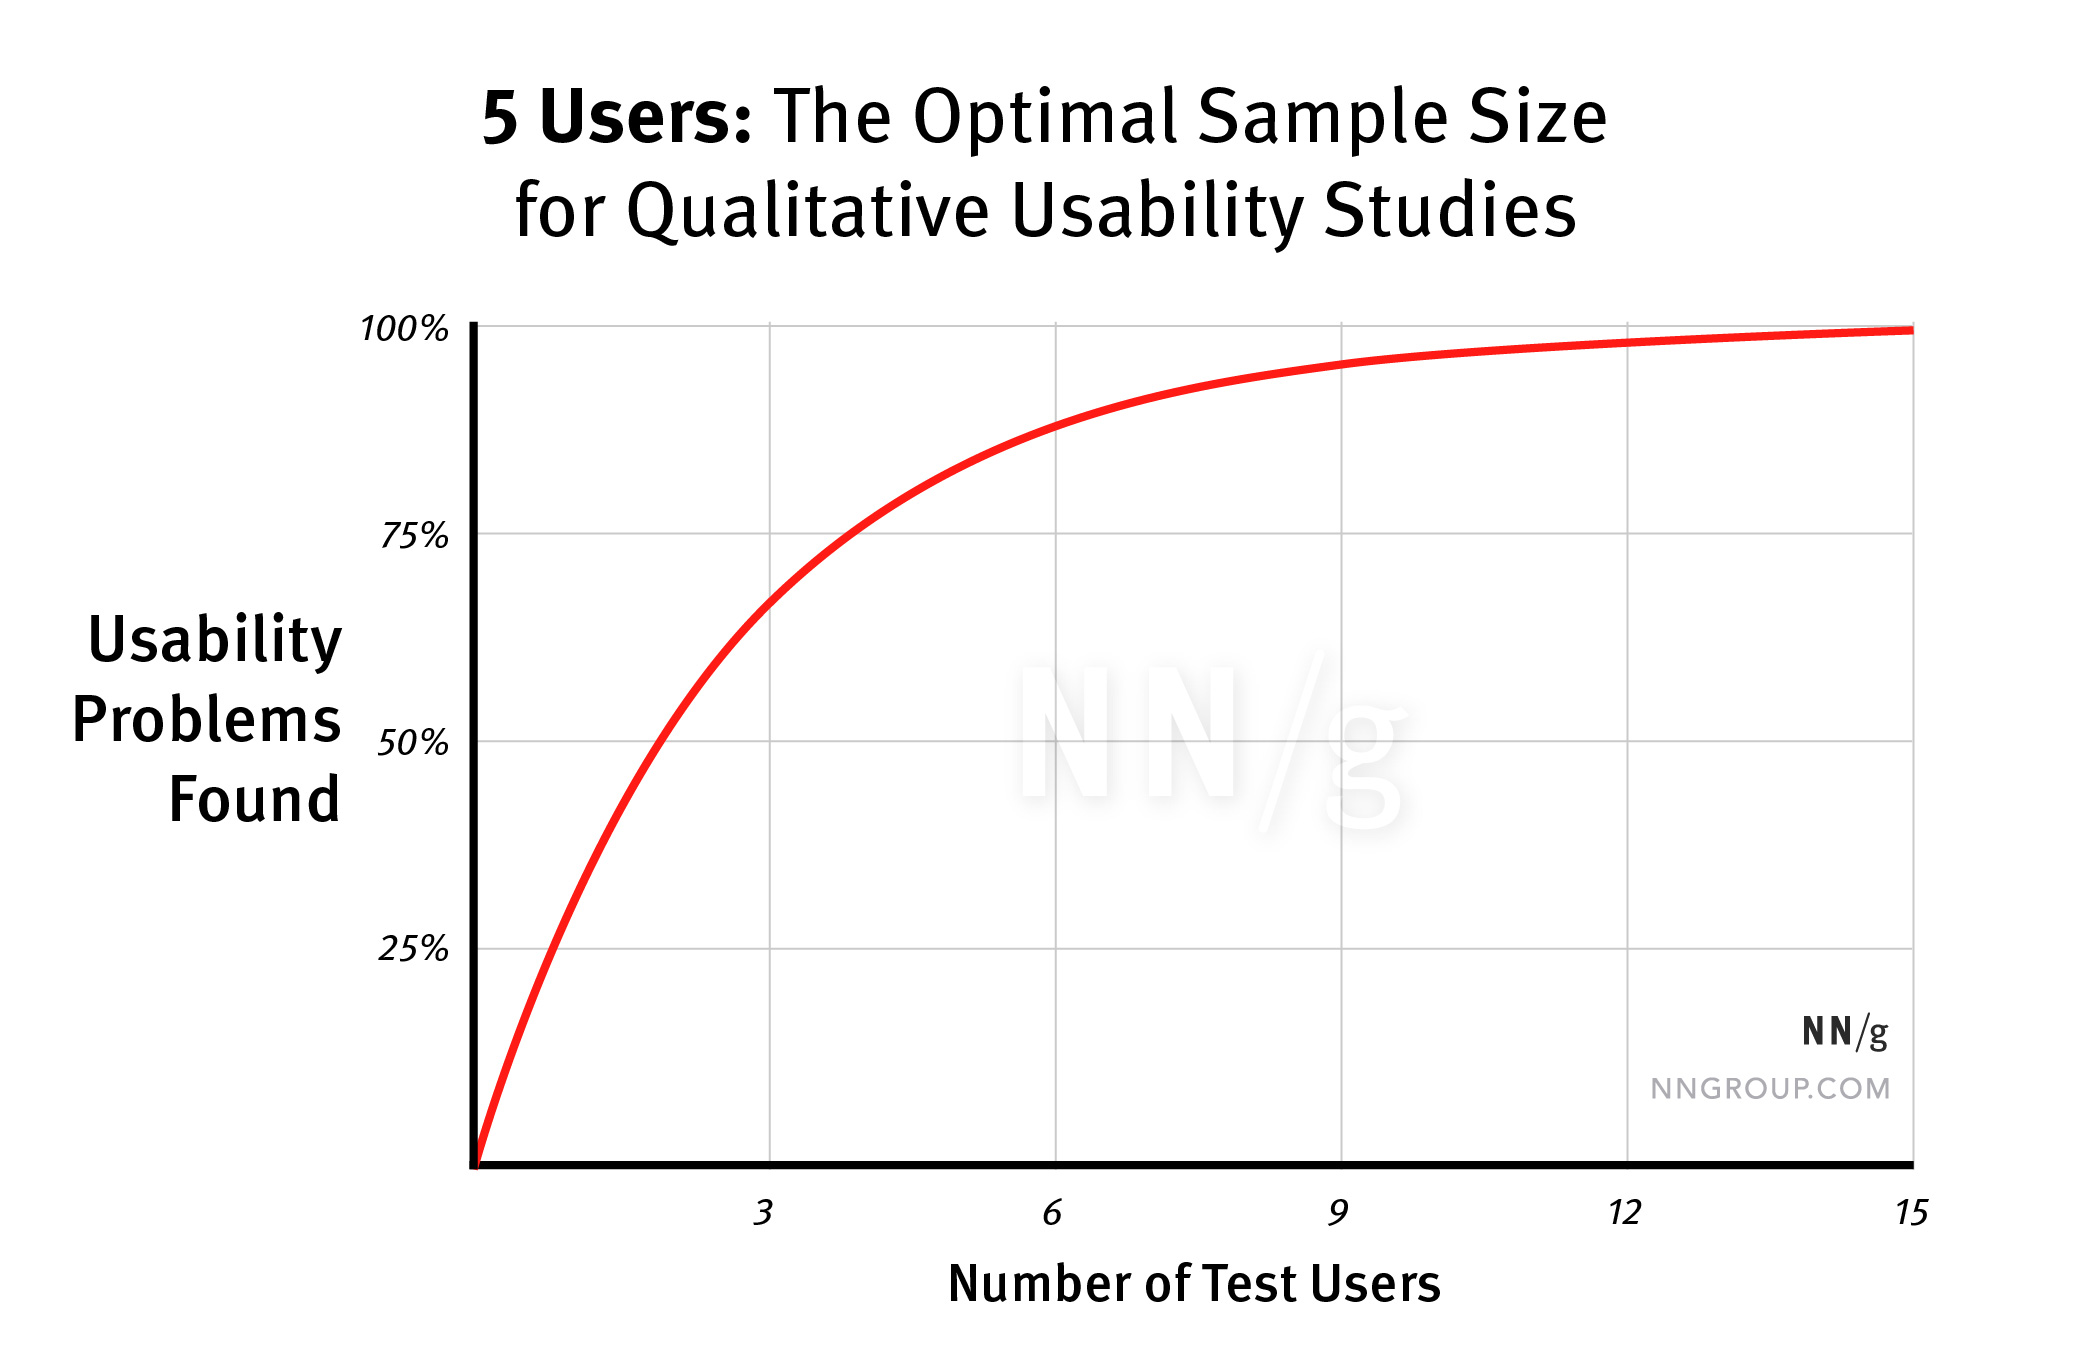
For homogeneous groups, you only need 5-12 users per group to hit thematic saturation (meaning you’ve heard the same thing enough times to know more participants won’t uncover anything new). 

The optimal sample size for qualitative usability studies

Source: Nielsen Norman Group

For example, a team designing a project management app tests their prototype with five users. Within hours, they’re hearing the same feedback on confusing navigation and a missing “undo” button. Bringing in more users after this is a waste of time and money, as they already know what needs fixing.

But if your app has wildly different user types, like accountants vs. designers, you’ll need to test those groups separately, adding 30-50% more participants. Accountants might love a clean, data-focused layout, while designers could prefer something more visual and intuitive. If you don’t separate them, you’ll end up solving no one’s problems. 

Now let’s take a look at the most common qualitative research methods and what is a good number of participants for a study:

1. User interviews

User interviews are part of foundational research, perfect for figuring out the needs, motivations, and frustrations of the people who’ll actually use your product. 

At Cieden, we talk to 8-12 participants per group, which is just enough to spot patterns without drowning in unnecessary data. Start small, listen, and stop when the same themes start repeating.

But remember that not everyone shows up, and the average no-show rate is about 10%. To avoid this derailing your project, over-recruit by 15-20%. So, if you’re aiming for 8-12 participants, invite around 10-14 to make sure you hit your target, even if a couple of people drop out.

  • when to use them: Early in the design process, before any sketches or prototypes.

  • use case: Imagine you’re designing a productivity app. User interviews let you see how users currently manage their tasks, whether it’s sticky notes or existing apps, providing the foundation for your design strategy.

  • the same sample size also applies to: contextual inquiries, field studies.

2. Usability testing

Usability testing is part of the formative research where you see if your design is doing its job or throwing users into confusion. Use it to fine-tune interfaces, catch confusing workflows, and identify what’s not working. 

For most tests, 5-9 users per group is the sweet spot. Research from Nielsen shows 3 studies with 5 users each can uncover 85% of usability issues, and Sauro found bumping that to 9 or 10 covers even more, especially when you’re dealing with diverse user types, like first-time shoppers versus regulars on an e-commerce site.

  • when to use it: When your ideas are taking shape, but before you’re too far down the road (think prototypes or wireframes). 

  • use case: Let’s say you’re building an e-commerce dashboard for sellers. A few rounds of usability testing with 5-9 participants can reveal if the workflow for adding products is intuitive or if there are roadblocks that need fixing.

  • the same sample size also applies to: concept testing, prototype testing.

3. Focus groups

Focus groups are where real conversations happen. You gather a small group, get them talking, and let their opinions flow. It’s foundational/exploratory research, which means it’s great for getting a snapshot of what people think about your product early in the design process.

At Cieden, we’ve found that 3-4 focus groups with 6-8 participants each are enough to spot patterns without overloading you with repetitive info. Plus, multiple sessions let you identify trends without being swayed by one particularly chatty group.

Number of participants in focus groups

Research shows that most groups hit saturation after about 3 sessions. For larger audiences, you might stretch to 5-6 sessions, but that’s rare unless your audience is wildly different across segments.

  • when to use them: When you’re exploring ideas or figuring out what matters most to your audience. 

  • use case: Redesigning a travel app? A group of Gen Z users might prioritize seamless social sharing, while millennial parents beg for offline modes and family deals. That’s gold you’d miss if you only surveyed individuals.

4. Co-design sessions

Co-design sessions are where your users roll up their sleeves and become part of the design process. It’s hands-on teamwork: you, your team, and the people who’ll use the product, all working together to solve problems and build something great.

For co-design, 10-12 participants strike the right balance. You get diverse perspectives without turning the session into a free-for-all. Besides, groups larger than 12 can lose focus, with quieter voices drowned out. 

  • when to use them: During formative research when you’re still shaping ideas and need to get a reality check. 

  • use case: Let’s say you’re designing a project management tool. Bring in power users who rely on these tools every day. They might push for customizable dashboards or smart notifications. Or imagine creating a meal-planning app. Families might suggest shared shopping lists, while solo users might ask for recipes based on fridge leftovers.

  • the same sample size also applies to: diary studies.

How many participants should be in a quantitative study?

Qualitative tells you the ‘why,’ but when you need to back it up with numbers, it’s time to go quantitative. But how many is enough? It depends on what you’re after:

  • if you’re testing trends or gathering quick feedback, 100 participants can do the job. Say you’re running a survey to see if users prefer a feature in dark mode. This smaller sample is enough to tell you if it’s worth exploring further.

  • for decisions where the stakes are higher, like choosing which homepage design drives more signups, you’ll need a statistically significant sample size – 385 participants

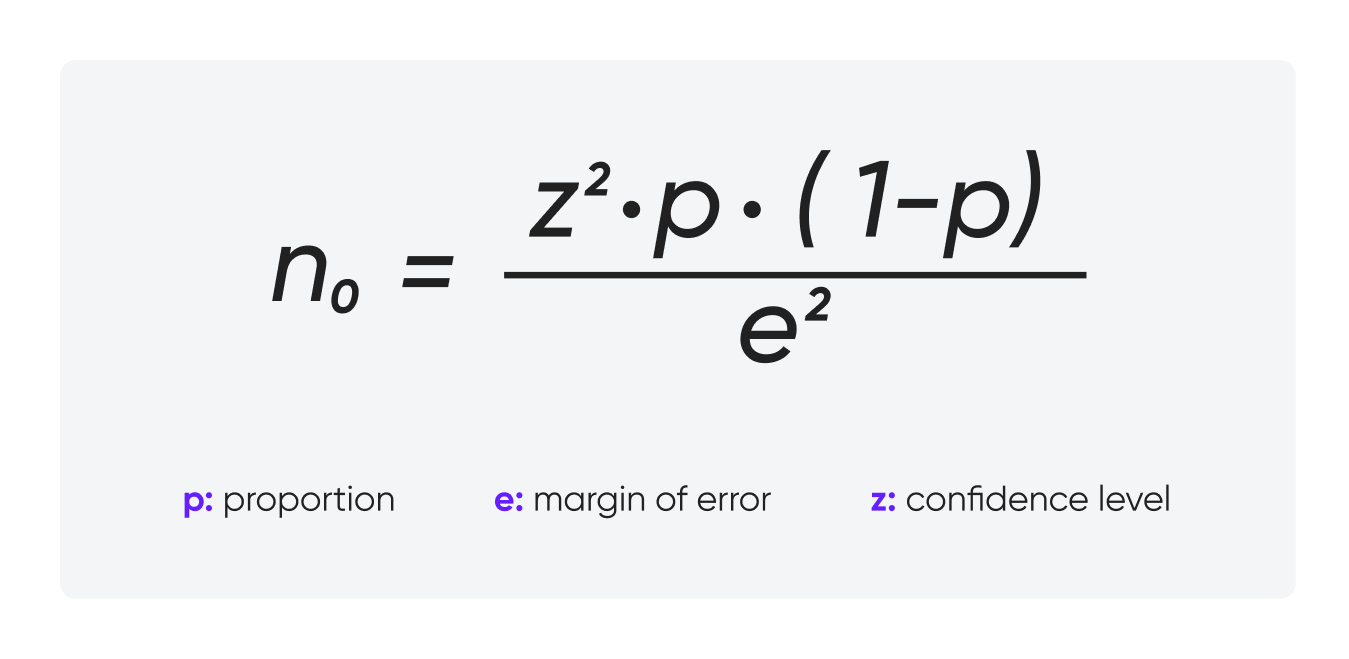
What is a statistically significant sample size? This number comes from standard statistical formulas based on three things:

  1. Confidence level (Z): How sure do you want to be about your results? Most people go with 95% confidence, meaning there’s only a 5% chance your data is off. This gives us a Z-score of 1.96.

  2. Margin of error (E): How much wiggle room are you okay with? A common choice is ±5%, meaning your results might be slightly off, but not by much.

  3. Proportion (p): The percentage of people you expect to respond a certain way. If you have no idea, use 50% (or 0.5). It’s the safest bet and gives you the biggest sample size.

Significant sample size formula

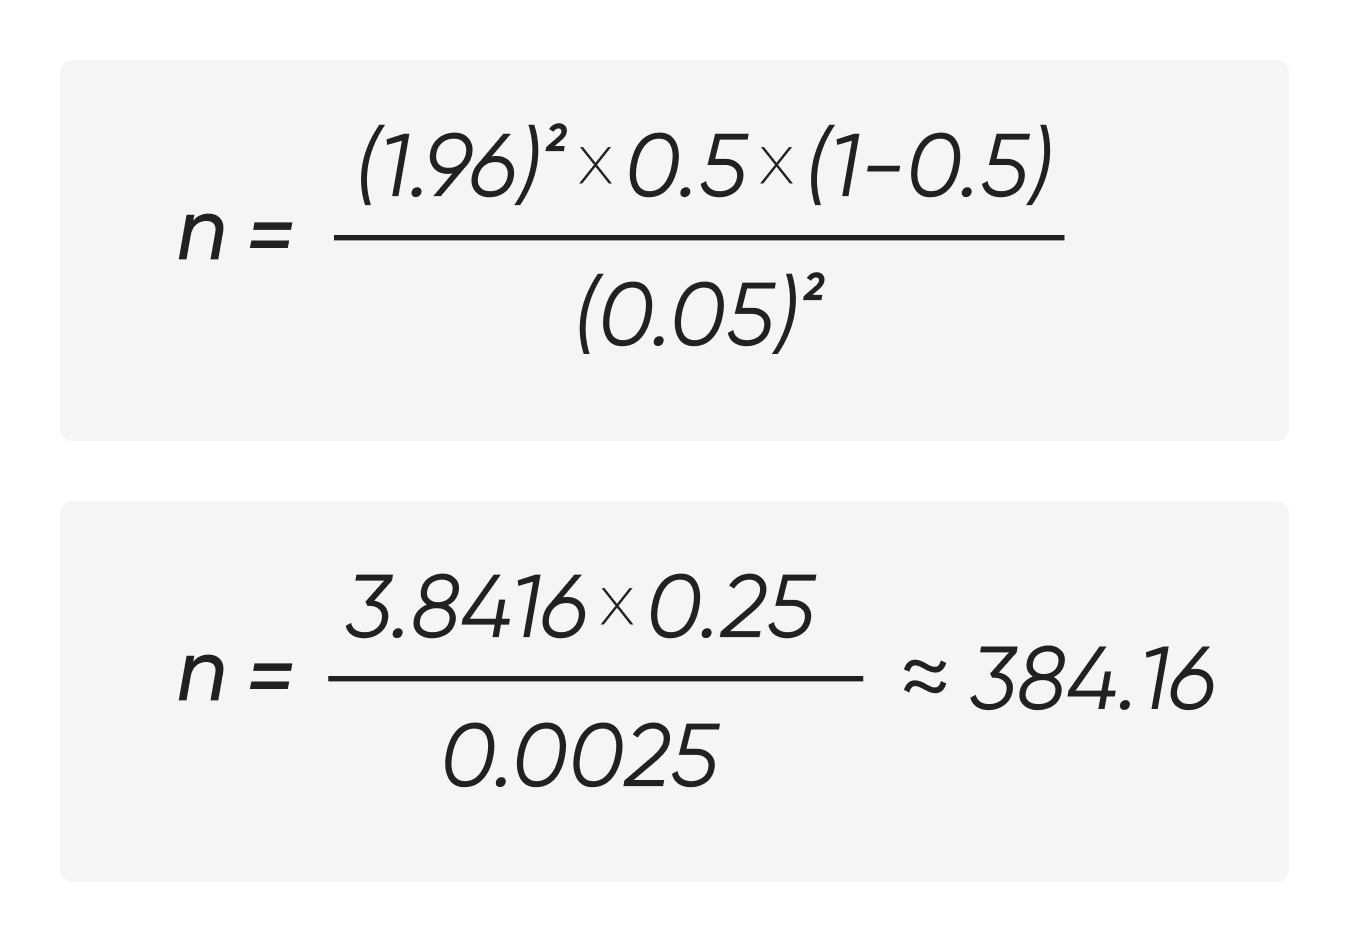
Plugging in the numbers:

  • Z=1.96

  • p=0.5

  • E=0.05

Significant sample size formula

Round that up, and you have 385 participants. This number works for large populations and gives you a 95% confidence level with ±5% margin of error. 

Here’s how you can apply this to real-world research methods:

5. Surveys

Surveys are the go-to when you need to scale up your findings, as they turn one-on-one insights into trends you can trust. But how many responses are enough to make decisions without overloading yourself with data?

At Cieden, we keep it straightforward: 90-100 responses per group for most digital design projects. Sometimes, you’ll need fewer or more, depending on what you’re doing:

  • quick checks: Nielsen Norman Group recommends starting with 40 responses if you’re looking for insights with a looser margin of error (say, 15%). This works when you just need to validate a direction, and speed matters more than perfection.

  • everyday decisions: Studies like Sauro show that 97 responses at a 95% confidence level with a 10% margin of error work well for medium-stakes projects, like validating a design or confirming user feedback.

  • high-stakes moves: 385 responses for big changes, like testing pricing strategies.

For example, imagine you’re testing a new onboarding flow. Start with 90-100 responses to see if the changes resonate with users. But if you’re rolling out a new subscription plan, you’ll want to gather more data to confidently measure user interest and conversion rates.

Tools like Qualtrics or SurveyMonkey can even help calculate precise sample sizes, but here’s a reference chart:

Confidence levels and sample sizes
Confidence level Margin of error Sample size When to use
95% 5% 385 High stakes: redesigns, pricing strategies, or diverse audiences.
95% 10% 97 Medium stakes: feature validation, iterative feedback.
95% 15% 43 Low stakes: exploratory research with a relaxed margin.

Things get trickier when your audience isn’t one-size-fits-all. Here’s what to consider:

  • multiple user groups: If you’re surveying both power users and casual users, aim for 90-100 responses per group.

  • international audiences: If your survey covers multiple regions, treat each country as its own group and adjust your sample size accordingly.

6. Baseline usability testing

This is your starting point for measuring how well your product helps users achieve their goals. Think of it as a "before snapshot" of usability, giving you hard metrics you can compare against after making improvements. This method is part of summative research, meaning it’s all about evaluating the overall effectiveness of a product or feature.

You’ll need at least 15 participants to gather statistically significant usability metrics like task completion rates. Sure, testing with 30 participants might give you a slightly clearer picture, but the marginal gains often aren’t worth the extra costs.

  • when to use it: When you’re setting benchmarks before launching a product, checking progress between updates to see if you’re moving the needle, or comparing designs to pick the winner before rolling out changes.

  • use case: Let’s say you’re updating a travel booking app, and you want to know if the new version makes things easier. Test 15 users on the old version to see how many can successfully book a trip and how long it takes them. After the redesign, test another 15 users and compare the results. Did task success rates go up? Did the process get faster? 

7. Benchmarking studies

Benchmarking studies are a way to measure usability metrics (time-on-task, error rates, and satisfaction scores) against industry standards or previous designs. This is summative research at its finest that tracks progress and proves your worth over time.

For benchmarking, you’ll want 20-30 participants for results you can trust. With fewer than 20 participants, your data lacks consistency and trends become harder to spot. But beyond 30, you’re just burning resources, as each new participant adds less value while eating up time and budget.

For metrics like time-on-task or task success rates, even 20 participants can provide results with ±10% margin of error at a 90% confidence level. Adding a few more participants (closer to 30) reduces that margin of error for diverse groups. This also allows you to smooth out variability (like those speedsters who finish in seconds or outliers who click everything but the right thing).

  • when do you use them: When comparing how your product stacks up before and after significant changes and assessing how your usability metrics measure up to industry leaders.

  • use case: Imagine you’re redesigning the checkout process for an e-commerce site. Your baseline benchmarking shows a 65% checkout completion rate with an average time-on-task of 3 minutes. After implementing a simplified design, you retest with 25 participants and find the completion rate has jumped to 82%, with time-on-task cut down to 2 minutes. 

8. A/B testing

A/B testing is how you settle design debates and see what actually works for your users. We usually recommend starting with 10,000+ participants per variation. 

Platforms like Optimizely back this up: 10,000+ participants are enough for most A/B tests to hit a 95% confidence level. But it all depends on what you’re testing:

  • big changes: If you’re testing two completely different layouts, 10,000 participants will show you what works. 

  • tiny tweaks: If you’re testing button colors or changing one word, you’ll need more (30,000-50,000 clicks per version) to hit statistical significance at 95% confidence and be sure those small changes actually matter.

This number also depends on a few things:

  1. Current performance: If your conversion rate is already high (like 10%), you can get away with fewer people. But if it’s low (say 2%), you’ll need more participants to see meaningful differences.

  2. Minimum detectable effect: This is the smallest improvement you’d consider meaningful. For example, if you’re testing two versions of a landing page and only care about at least a 5% lift in conversions, you’ll need more users than if you’re okay with detecting a 10% lift.

  3. Confidence level: Want to be 95% sure? That means a bigger sample size. Need a quicker answer? Stick with 90% confidence.

Let’s say you’re testing two landing page headlines: 1) Version A (the current one) that converts 5% of users, and 2) Version B (the new one) that needs to boost that by at least 10%. To be 95% sure Version B works better, you’d need about 31,000 users per version. But if your baseline conversion rate was higher, like 10%, and you wanted to detect a 20% improvement, you’d only need around 2,900 per version.

Optimizely Sample Size Calculator is a great tool to help you figure out a sample size for a specific project.

Stop guessing, start winning!

Whether it’s 5 users or 1,000, the right number of participants is the key to creating designs that delight and decisions you can trust. Start smart, save money, and solve real problems with precision.

Need help with user research, interviews, or testing? At Cieden, we specialize in turning insights into impact. Let’s chat about how we can help you build products your users will love! 🚀

FAQ

How many participants do I need for a usability test?

You need 5–9 participants per group for most usability tests. Research shows that 5 participants can uncover 85% of usability issues, and adding a few more participants (up to 9) helps identify even more, especially when testing with diverse user groups.

How to calculate a statistically significant sample size?

To calculate a statistically significant sample size, use the formula in the article. There, Z is the confidence level (1.96 for 95%, 1.645 for 90%), p is the expected proportion (use 0.5 if unsure), and E is the margin of error (±5% is common). For example, at a 95% confidence level with a 5% margin of error, you’d need around 385 participants. If math isn’t your thing, tools like Qualtricks Sample Size Calculator can do the work for you!

Do qualitative studies need large samples?

No, qualitative studies thrive on smaller, focused samples. For homogeneous groups, 5–12 participants are enough to reach thematic saturation, where additional participants provide no new insights. Larger samples may be needed if you’re studying highly diverse user types or segments.

What sample size is statistically significant?

The sample size needed for statistical significance depends on your desired confidence level, margin of error, and the variability in your data. A commonly used benchmark is 385 participants, which provides a 95% confidence level with a ±5% margin of error for large populations. If your margin of error increases (e.g., ±10%), you can use smaller samples.

start your project with us.

Getting in touch
is easy .
Thank you for your message. It has been sent